Windows can warn about low memory even when Task Manager shows free RAM, because the warning reflects the commit limit rather than physical memory alone. A too-small paging file or a process that leaks memory can exhaust committed virtual memory while RAM still looks available. Check the commit figure, enlarge the paging file, and track down any process whose memory keeps climbing.
This guide walks through the process in clear illustrated steps, from the first preparation to a finished result. Each step has its own picture, so you can compare your progress as you go.
How to use this guide
Work through the steps in order. Method 1 of 3 covers the basics, and the later methods offer alternatives and finishing touches. If you only have a minute, skim the Quick steps box above and come back for the details.
Related guides
- How to Prevent frizzy hair
- How to Store fresh herbs
- How to Add color to beeswax
- How to Deal with a difficult coworker
- Browse all Windows Troubleshooting guides
- All 52runoob guides
Trusted external resources
- Microsoft Learn — Memory allocation errors from slow page file growth
- Microsoft Learn — Low system memory and commit size
- Microsoft Support — Windows Memory Diagnostic tool steps
A note on sources
We check each guide against the official resources listed in References at the end of this article. External links open in a new tab; the related guides above stay on this site.
Quick steps
- Open Task Manager and compare the commit value with the commit limit.
- Confirm the paging file is enabled and not capped too low.
- Increase the custom paging file initial and maximum sizes, then restart.
- Sort processes by memory and commit size to find a leaking program.
- Close or restart the leaking app and update its version or drivers.
- Run Windows Memory Diagnostic if warnings continue with no obvious leak.
Things you'll need
- A Windows 11 PC with administrator access
- Task Manager and the advanced system settings panel
- The installer or latest version of any suspect application
- A few restarts and about 20 minutes for a memory test
Step-by-step
Method 1 of 3: Check Commit and Paging File
Step 1: Open Task Manager
Use the keyboard shortcut for Task Manager and switch to the Performance tab.

Step 2: Read the commit line
Note the current commit value and compare it with the commit limit shown in memory performance.

Step 3: Open advanced system settings
Search for advanced system settings and open the performance options from System Properties.
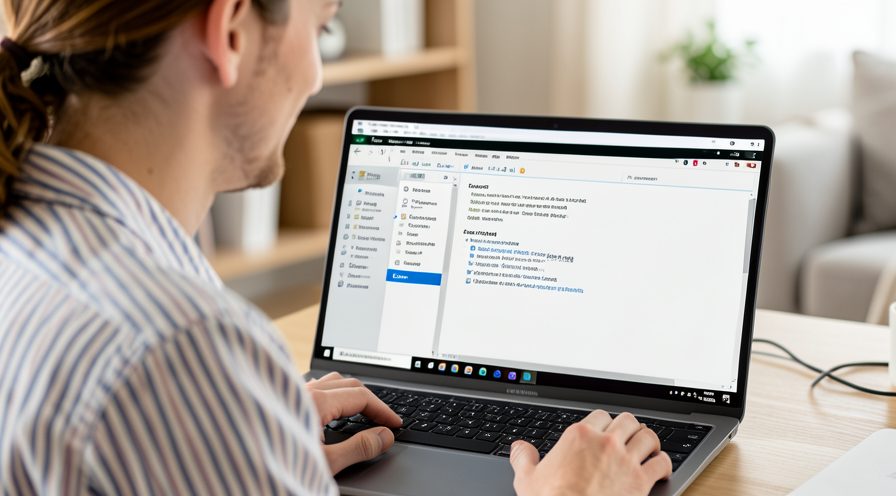
Step 4: Open virtual memory settings
Go to the Advanced tab and change the virtual memory settings under Performance.

Step 5: Check automatic management
See whether automatic paging file management is enabled and which drives have a pagefile.

Step 6: Apply a larger paging file
If the limit is too low, select a custom size with a larger maximum and restart.

Method 2 of 3: Find the Process Eating Memory
Step 7: Open the Processes tab
Show the Processes tab in Task Manager and sort by the memory column.

Step 8: Add the commit size column
Use the select columns dialog to show commit size for deeper memory analysis.

Step 9: Sort by commit size
Sort the list so the processes reserving the most virtual memory appear first.

Step 10: Watch for steady growth
Observe the top process for a few minutes to see whether its memory keeps climbing.

Step 11: Close or restart the suspect
End the leaking task or restart the application to release the memory it holds.

Step 12: Update or reinstall it
Install the latest version of the offending program or its driver to fix the leak.

Step 13: Monitor it over a longer session
Leave the window open for a while and check whether the same process keeps rising.

Method 3 of 3: Verify Hardware and Drivers
Step 14: Check free disk space
Make sure the drive holding the paging file has enough free space to grow.

Step 15: Update system drivers
Install optional driver updates through Windows Update, especially chipset and graphics drivers.

Step 16: Open Windows Memory Diagnostic
Search for the memory diagnostic tool from the Windows start screen and launch it.

Step 17: Restart and run the test
Choose to restart and check for problems, then wait while the memory test runs.

Step 18: Switch to extended testing
Press the function key for test options and select the extended test mix for a deeper check.

Tips
- The commit limit includes RAM plus the paging file, so free RAM alone does not mean low pressure.
- A process that slowly grows in memory over hours is a stronger leak clue than a one-time spike.
- Restarting clears a leak only temporarily and does not fix the underlying bug.
Warnings
- Setting the paging file too large wastes disk space and can slow the drive.
- Do not disable the paging file completely, since many apps rely on committed memory backing.
- Force-closing system processes can cause instability or loss of unsaved work.
Frequently asked questions
Why does Windows say low memory when Task Manager shows free RAM?
The low memory warning is based on the commit limit, which is physical RAM plus the paging file, not on free RAM alone. A small or disabled paging file can keep that limit low even with plenty of RAM unused. Check the commit line in the Performance tab to see how close you are to the limit.
How big should my paging file be?
For most systems, letting Windows manage the size automatically is the safest choice. If you set a custom size, a common starting point for the initial size is about one and a half times the installed RAM, with a larger maximum to absorb spikes. The exact need depends on your peak commit, which you can read from Task Manager.
What is a memory leak and how do I find it?
A memory leak happens when a program reserves memory and never releases it, so its usage keeps rising over time. In Task Manager, sort by memory or add the Commit size column and watch which process grows steadily. Restarting that app frees the memory temporarily, but updating or reinstalling it is the real fix.
Can faulty RAM cause low memory warnings?
Faulty memory modules usually cause crashes or blue screens rather than a clean low memory warning, but it is worth ruling out. Run Windows Memory Diagnostic, choose the extended test, and check the result in Event Viewer after reboot. If errors appear, test each memory stick separately or replace the failing module.
References
- Microsoft Learn — Memory allocation errors from slow page file growth. https://learn.microsoft.com/en-us/troubleshoot/windows-client/performance/slow-page-file-growth-memory-allocation-errors
- Microsoft Learn — Low system memory and commit size. https://learn.microsoft.com/en-us/troubleshoot/developer/visualstudio/ide/visual-studio-unresponsive-resources-consuming-memory
- Microsoft Support — Windows Memory Diagnostic tool steps. https://support.microsoft.com/en-us/help/4028391
- wikiHow — How to Fix 'Low Memory' Warnings When You Have RAM Free. https://www.wikihow.com/Free-Up-RAM-on-Your-Computer
Every guide is reviewed against its sources. See our editorial policy.



Reader comments
0 so farFinished this guide? Tell other readers what worked, what didn't, and what you would change.